
Workshop 2022-02-18: MEG Injection
This document describes how a characteristic process industry asset can be represented using the PCA RDL developed in Readi. We describe a MEG Injection use case, starting from the high-level view of streams, adding details in the P&ID, and further including attributes from specifications in data sheets.
The contents of this page were prepared by the Readi project (https://readi-jip.org/) for the initial presentation of the PCA, ISO 15926-14 based RDL on 2022-02-18.
The page is currently incomplete – more details will be added at a later date. Diagrams as shown here have been made from the example ontology, using the Gruff tool from Franz, Inc.
Click the following link to download the demonstration OWL ontology used in the workshop: demo-injection-20220218.ttl.
In the Process Flow Diagram, we see a gas stream that flows from a separator to a heat exchanger. The stream is subject to injection of MEG (Mono Ethylene), a chemical injection that dehydrates the gas before it enters the heat exchanger.
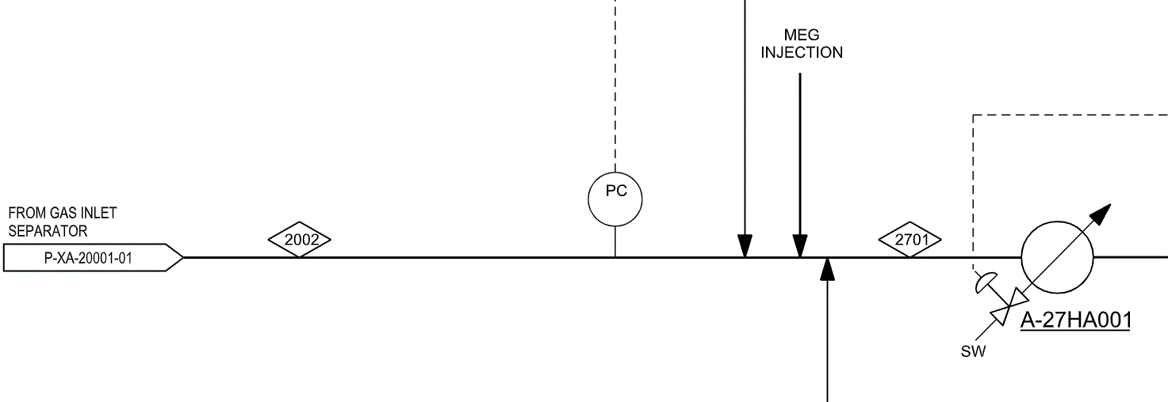
Figure 1: Process Flow Diagram (PFD) excerpt
Main items to be included in the RDL-compliant asset model:
The Piping and Instrumentation Diagram (P&ID) extends the information from the PFD with specifications of flowlines, equipment, and instrumentation on a much more detailed technical level.
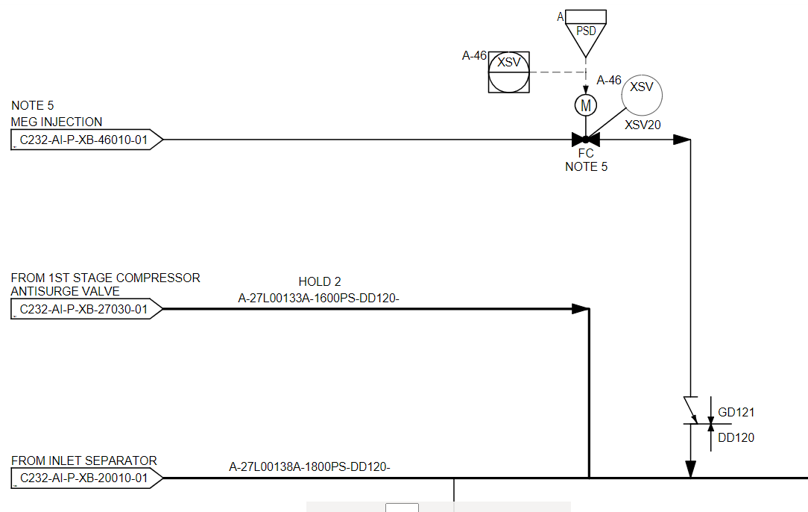
Figure 2: Piping and Instrumentation Diagram (P&ID) excerpt
Some information from the equipment data sheet will be added to the demo use-case to illustrate the unambiguous representation of technical characteristic of an equipment provides by the vendor.
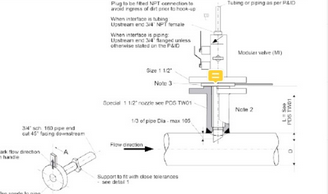
Figure 3: Equipment data excerpt
Stream Model Instance diagram
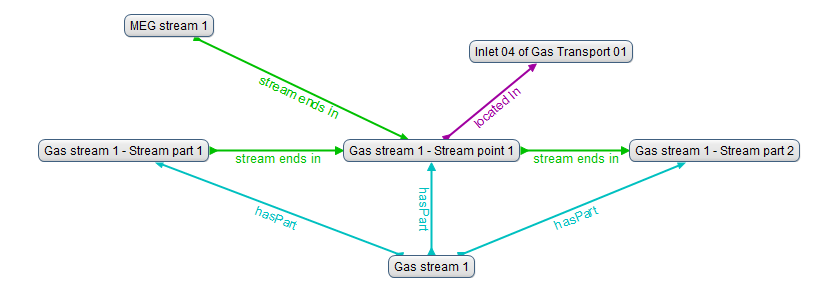
Figure 4: Stream Model Instance diagram
The Gas stream 1 individual object represents the actual gas flow from the separator inlet to the heat exchanger as seen in the PFD diagram. The Gas stream 1 has 2 segments identified by the 2 diamond symbols with a unique ID and they are instantiated as Gas stream type with a hasPart relation from the main Gas stream 1 object. The MEG stream 1 individual object represents the injected chemical flow and the Gas stream 1-Stream point 1 represents a point in the gas stream where the injected chemicals meets the gas flow.
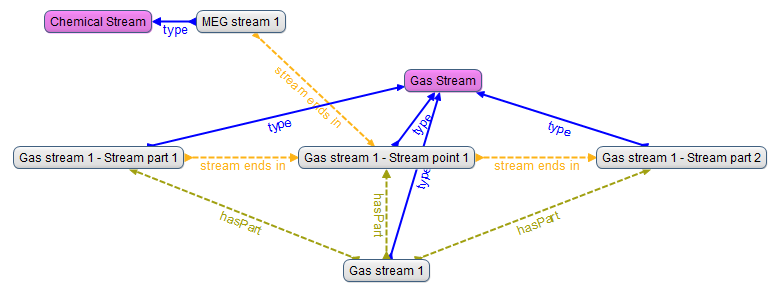
Figure 5: Stream Model Instance diagram, with stream types
The stream model diagram extended by the different specialisation of Stream type representation.
Activity Model Instances: Process activities with type.
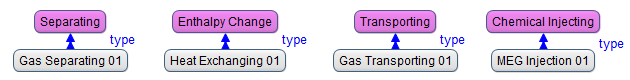
Figure 6: Process activities, with types
The diagram identifies the different use-case related activities described in the PFD document with the activity type of the individual object.
Activity Model: Injection at process point.
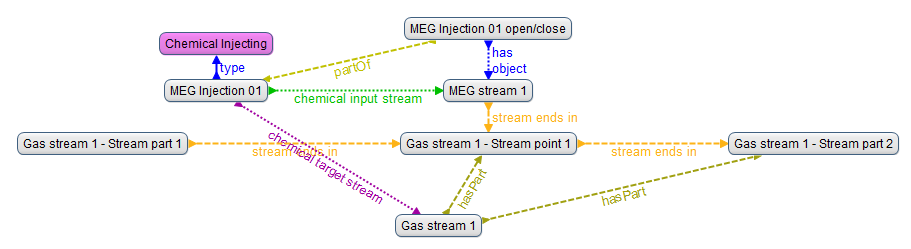
Figure 7: Injection activity, at process point
The object model shows the relation between the MEG injection 01 activity and the MEG stream 1 where the MEG injection stream is an input stream and to the Gas stream 1 which is the target stream of the main injection activity. Furthermore, the model identify a sub activity of the MEG injection 01 by the partOf relation to an open/close activity within the main injecting activity. The open/close activity is identified in the P&ID diagram related to the MEG stream 1 object.
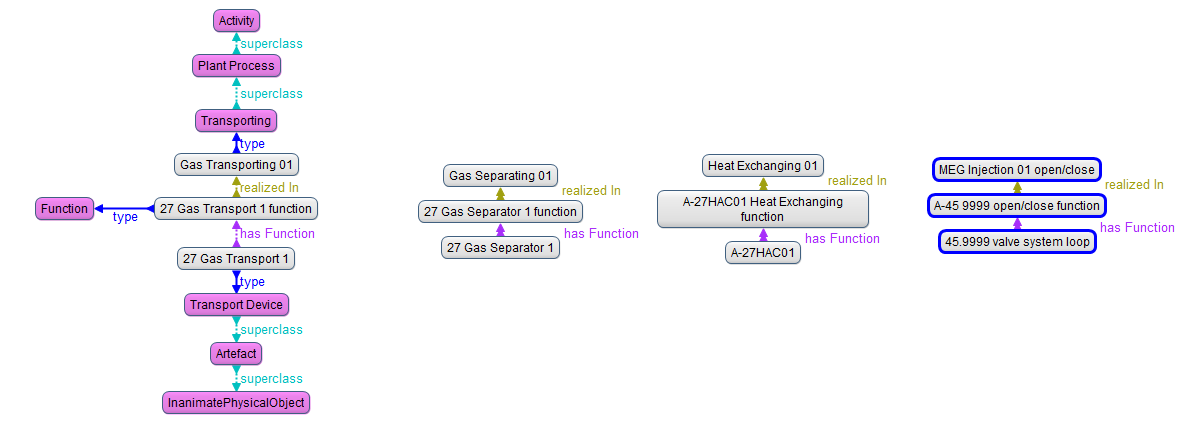
Figure 8: Function – realized in
The functional model includes all the identified process activities such as Gas transporting, Gas separating, Heat exchanging and the open/close sub-activity of the MEG injecting main activity. Each physical equipment involved in a specific activity is related through the equipment’s function, which has a realized In relation to the specific activity.
A new object Inlet 04 of Gas Transport 01 has been introduced. It represents a physical item where the MEG injection takes place and therefore the Gas stream 1 - Stream point 1 object is related with a by located In relation to the inlet type object. with other words the stream point has a location in an inlet type equipment.
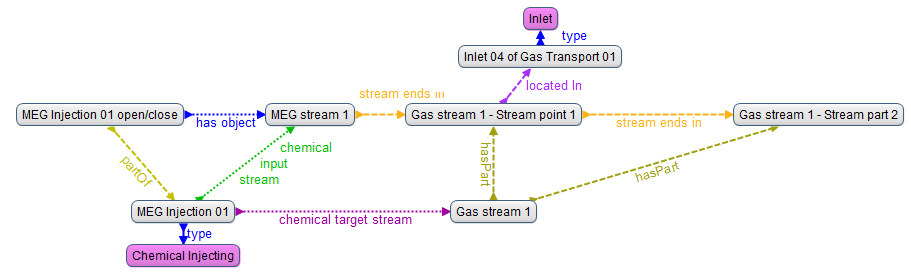
Figure 9: Injection activity, MEG at Inlet 4
The model diagram includes individual objects identifying the transport system (S27) responsible for the gas flow within the gas separating system, and its 5 inlet terminal and 1 outlet terminal parts. Furthermore, it shows the connectedTo relation between the different terminals owned by the different interconnected systems. Inlet and outlet terminals has a partOf relation to the system and/or equipment they belong to and has a connectedTo relation to the other terminals the parent system has an interconnection with.
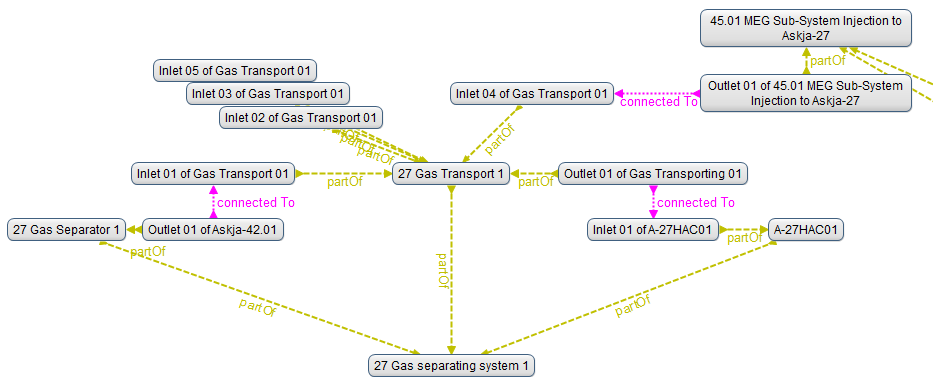
Figure 10: System 27 Gas Transport
The following object diagram shows the MEG Injection sub-system (S45.01) and a specific Valve system loop component as part of the actual sub-system. Each identified equipment is illustrated in the P&ID diagram and instantiated in the object model. Please notice that the model does not include all the components of a typical Valve system loop as such a completeness was not intended in this use-case demonstration.
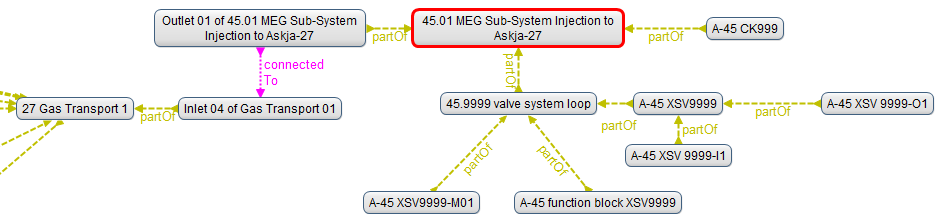
Figure 11: Sub-System 45 MEG injection
Temperature and pressure values are illustrated in the following diagram, for a valve and a stream. The model applies classification of datum individuals, as described in the pattern Unit of Measure.
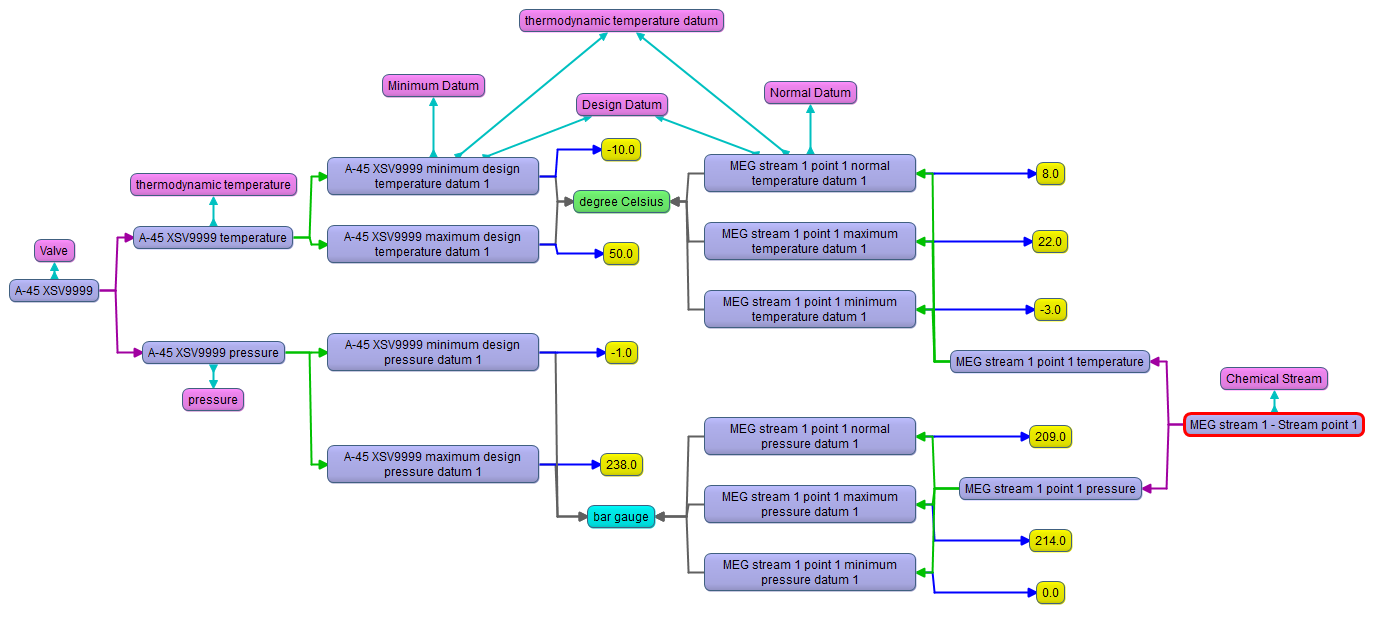
Figure 12: Quantification of physical quantities
The following diagram provides a full overview of all individual objects identified and instantiated from the use-case documentation and includes all the relations between the objects as we could seen in the different diagrams above. The following picture shows individual objects with relations only, without the representation of the classes the objects are member of .
An object model which contains the complete knowledge about any physical asset including the system breakdown structure and the physical topology down to the necessary detail level will provide a digital Integrated asset model representation of the physical world.
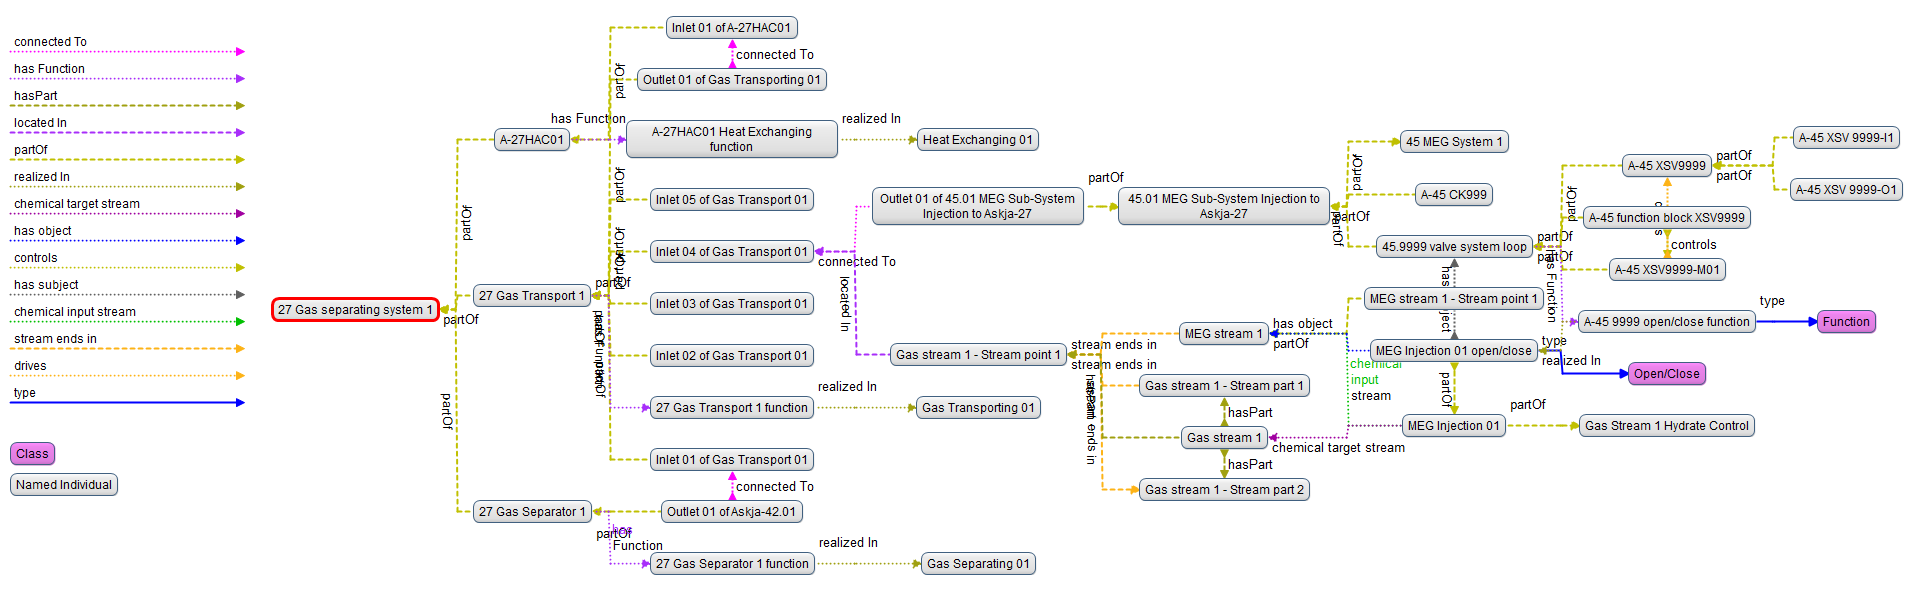
Figure 13: All individuals